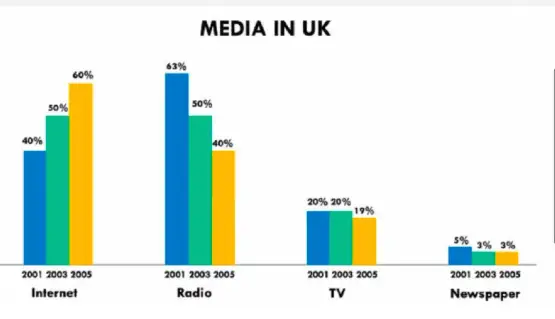
Look at the text below. In 25 seconds, please speak into the microphone and describe in detail what the graph showing. You will have 40 seconds to give your response.

The following graph gives information about media in UK. The items include internet, TV, newspaper and radio. According to this graph, in internet, the value of 2005 is around 60%, and that of 2003 is lower, which is around 50%. You can see from this graph that the highest value of 2001 is in radio, which is 63%. In conclusion, newspaper has the lowest value in 2005, about 3%
« Previous 1 2 3 4 5 6 7 8 9 10 11 12 13 14 15 16 17 18 19 20 Next »
