Look at the text below. In 25 seconds, please speak into the microphone and describe in detail what the graph showing. You will have 40 seconds to give your response.
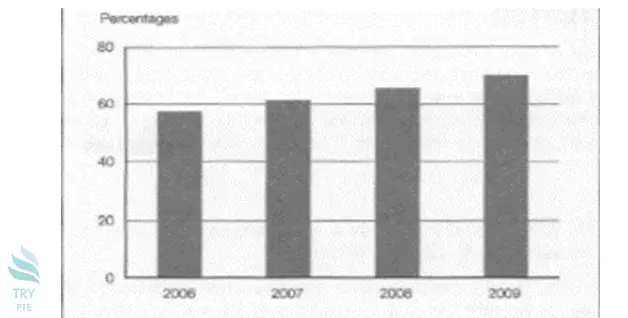
| Households with access to The Internet, UK |
This bar chart vividly shows the information about households with access to the Internet in UK.To begin with, we can see that there is a rising trend in this picture from 2006 to 2009. According to this paragraph, the largest number can be found in 2009 which is about 70%, while the smallest number can be found in 2006 which is about 58%. Last but not least, the second largest number can be found in 2009 which is about 70%while the second smallest number can be found in 2008 which is about 62%. Overall, we can say that in the upcoming years the usage of internet will definitely be increased.
« Previous 101 102 103 104 105 106 107 108 109 110 111 112 113 114 115 116 117 118 119 120 Next»