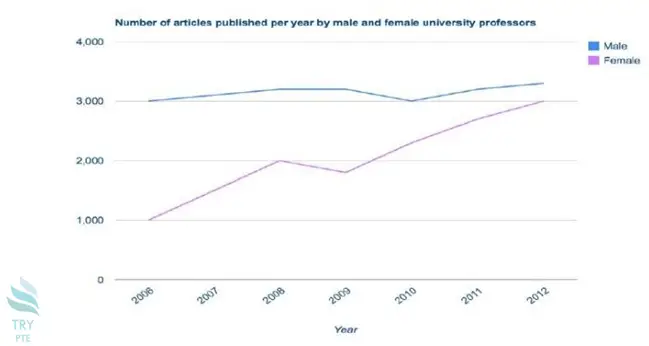
Look at the text below. In 25 seconds, please speak into the microphone and describe in detail what the graph showing. You will have 40 seconds to give your response.

This line chart shows the information about the number of articles published per year by male and female university professors from 2006 to 2012. To begin with, we can see that the number of articles are ranging from 1000 to 4000 per year. According to the graph, for male university professors, the numbers of published articles per year are almost constant around 3000 throughout the period. Last but not the least, for female university professors, the number of published articles increased from 1000 in 2006 to 3000 in 2012. In conclusion, the number of articles published by male and female professors are getting more and more even with the time goes on.
« Previous 181 182 183 184 185 186 187 188 189 190 191 192 193 194 195 196 197 198 199 200 Next»
