Look at the text below. In 25 seconds, please speak into the microphone and describe in detail what the graph showing. You will have 40 seconds to give your response.

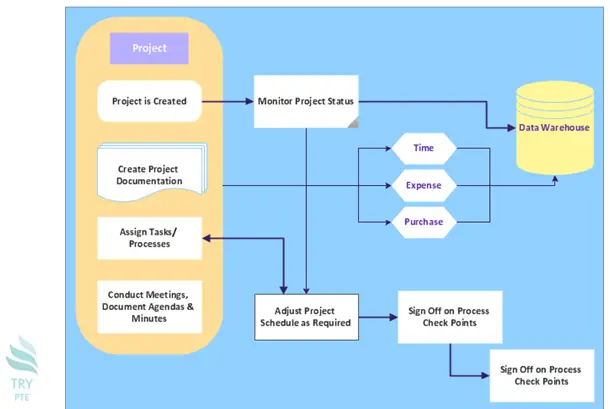
This flow chart shows the information about the project management process. To begin with, we can see that the project would be monitored after it is created, and then it would be sent to either the data warehouse or to be adjusted to the project schedule as required. According to the graph, after the creation of project documentation, the time, expense and purchase information would be tested and soon it would be sent to the data warehouse. Last but not the least, the processes of assigning tasks include adjusting project schedule, signing off on process and singing off on process. In conclusion, the last step is to conduct meetings, document agendas and minutes.
« Previous 181 182 183 184 185 186 187 188 189 190 191 192 193 194 195 196 197 198 199 200 Next»
