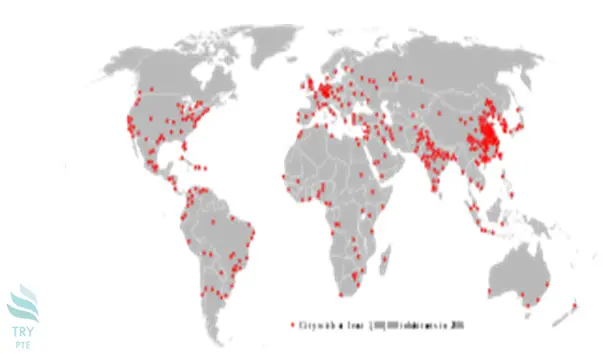
Look at the text below. In 25 seconds, please speak into the microphone and describe in detail what the graph showing. You will have 40 seconds to give your response.

This map shows the information about city inhabitants all over the world.To begin with, we can see that in east Asia, especially China, there are a lot of cities with at least one million inhabitants in 2006. According to the graph, as we move towards the west, we found that South Asia and Europe also have many cities with high density of population. Last but not the feast, as we move towards the west again, we can see that in Africa, North America and South America, only coastal cities have more than one million inhabitants. In conclusion, this is a very useful graph, and it helps us to better understand the population distributions in major cities.
« Previous 221 222 223 224 225 226 227 228 229 230 231 232 233 234 235 236 237 238 239 240 Next»
