© 2023 Try PTE | All Right Reserved | Privacy Policy| Disclaimer
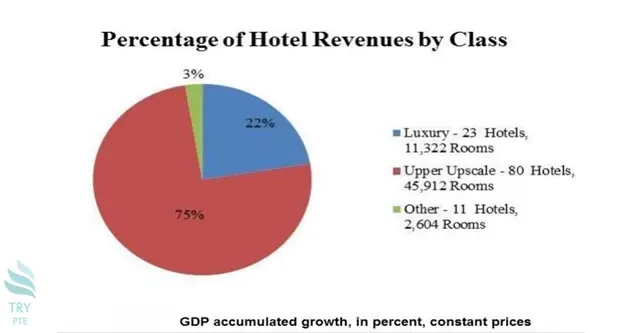
Look at the text below. In 25 seconds, please speak into the microphone and describe in detail what the graph showing. You will have 40 seconds to give your response.

« Previous 261 262 263 264 265 266 267 268 269 270 271 272 273 274 275 276 277 278 279 280 Next»