Look at the text below. In 25 seconds, please speak into the microphone and describe in detail what the graph showing. You will have 40 seconds to give your response.
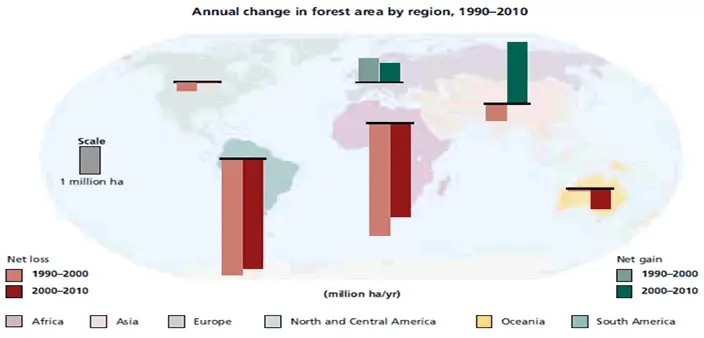
The following graph gives information about the annual change in forest area by region.Data of different areas are displayed on the map. The items include net gain, states, and net loss,According to this graph, the largest areas of forest gain in the 1990-2000 year are in China. In comparison, the smallest areas of the net gain in 1990-2000 are in Africa. You can see from this graph that the largest areas of net loss in 1990-2000 are in Africa. In conclusion, the area of the net gain in China is much larger than that of the net loss.