Look at the text below. In 25 seconds, please speak into the microphone and describe in detail what the graph showing. You will have 40 seconds to give your response.
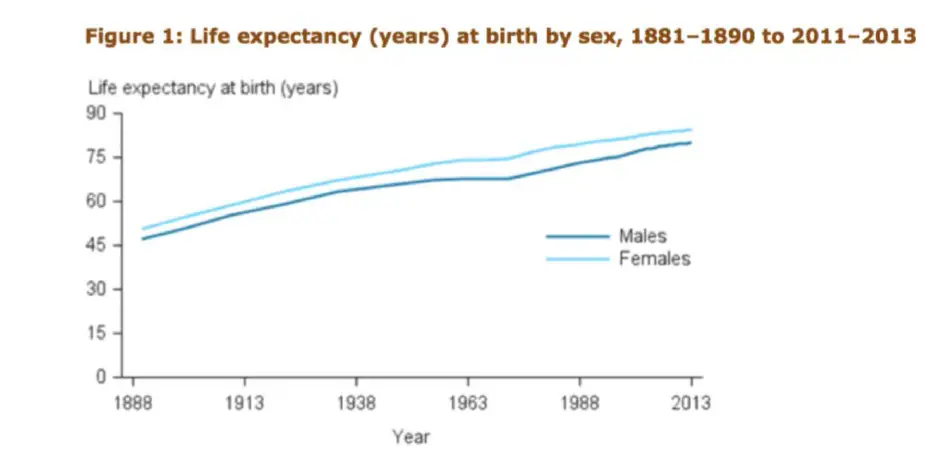
The image shows the information about life expectancy at birth by sex between 1890 and 2016. According to the line graph, it can be clearly seen that a man born in 2016 can expect to live to the age of 80 years and a woman would be expected to live to 85 years, compared to 45 and 50 years, respectively in 1890. After analyzing the key aspects, it can be concluded that the image shows crucial information about life expectancy at birth by sex between 1890 and 2016 which is strongly supported by data and facts