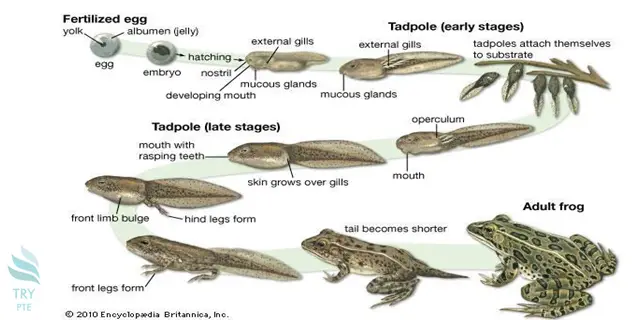
Look at the text below. In 25 seconds, please speak into the microphone and describe in detail what the graph showing. You will have 40 seconds to give your response.

This flow chart shows the information about the lifecycle of frog. To begin with, we can see that there are several sections in this picture, that is, a fertilized egg, tadpole for both early and late stages, adult frog, yolk, external gills, skin grows over gills and so on. According to the graph, it begins with the process of fertilized eggs with the process of embryo, hatching and developing mouth. Last but not the least, it ends with the process of becoming an adult frog. Before it, front legs form and the tail becomes shorter. In conclusion, I think it is very beneficial because it tells me the information about the lifecycle of frog.
« Previous 181 182 183 184 185 186 187 188 189 190 191 192 193 194 195 196 197 198 199 200 Next»
