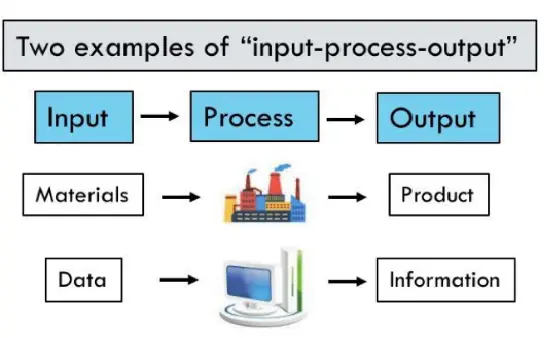
Look at the text below. In 25 seconds, please speak into the microphone and describe in detail what the graph showing. You will have 40 seconds to give your response.

The following graph gives information about two examples of input-process-output.It shows how the process is done. The steps include materials, factory, and product, According to this graph, the first step is input materials. According to this graph, the second step is to go to the factory, You can see from this graph that the third step is to become the product, which is the output. You can also see from this graph that the next step is data is the input. According to this graph, the next step is to go to the computer. According to this graph, the next step is to become the information, which is the output. In conclusion, this graph is very informative
« Previous 281 282 283 284 285 286 287 288 289 290 291 292 293 294 295 296 297 298 299 300 Next»
